Lineweight and Plot Style Conventions: CTB vs STB Explained
How CTB and STB plot style tables control lineweight and appearance in AutoCAD, and how to choose the right convention for a project.
Sumana KumarUpdated 19 June 202610 min read
Why identical geometry can plot completely differently
I've watched two drawings built from the exact same geometry, same layers, same blocks, come out of two different plotters looking like they belonged to two different offices, one with crisp, purposeful line hierarchy and one where every wall, dimension and hatch printed at the same flat thickness, and the entire difference came down to the plot style table sitting behind the print, not the drawing itself. Lineweight and plot style conventions are one of those things that don't show up at all on screen in some default AutoCAD views, but completely control how a drawing actually reads once it's on paper or in a PDF.
This disconnect between what you see while drafting and what actually gets issued is exactly why plotting problems tend to surface late, right before a deadline, when someone finally exports the PDF to send to a client and notices the hierarchy that looked so clear on screen has completely flattened out, and by then there's no time left to trace the problem back to a page setup that was pointed at the wrong table three weeks earlier.
Older hand drafting practice actually solved this same problem physically, a draftsperson genuinely pressed harder on a pencil or used a thicker technical pen for a cut line than for a construction line, and the plot style table is really just CAD's way of automating that same physical judgment call at print time rather than relying on a person's hand pressure sheet after sheet.
What a plot style table actually controls
A plot style table is essentially a lookup table that AutoCAD applies at plot time, mapping something in your drawing, a color, or a named style, to an actual output setting, lineweight, screening percentage, whether it plots in black or in the object's actual color, even line end and join style. Two AutoCAD drawings can have identical geometry and identical layers, but if one is plotted through a table that maps everything to a fine, uniform lineweight and the other through a table with proper hierarchy, the results look like entirely different drawings once printed.
It's worth being clear that a plot style table is a project or template level setting, not something baked into an individual drawing's layers, which is exactly why the same DWG file can plot two different ways depending on which CTB or STB happens to be referenced from that particular layout's page setup, a detail that trips people up because it means the drawing itself never fully tells you how it will look printed until you check which table is actually attached.
This also means a plot style table travels somewhat independently of the drawing file itself, sent to a consultant or printed at a different office without the correct CTB or STB alongside it, and the recipient's own default table takes over instead, which is exactly why sharing the plot style file as part of a project handover, not just the DWGs, is worth treating as a standard part of any external transmittal rather than an afterthought.
Color dependent plot styles (CTB): how the convention works
Color dependent plot style tables, CTB files, are the older and still more common of the two conventions, and they work by mapping AutoCAD's built in colors to specific plot settings, so every object drawn in color 1, red, plots however color 1 is defined in the CTB, every object in color 7, white or black, plots however that's defined, and so on. In practice this means your whole lineweight strategy in a CTB workflow rides on layer color, put your grid lines on a dedicated color, your wall outlines on another, your dimension text on another, and the CTB does the rest at plot time based purely on what color each object happens to carry.
The practical implication that catches people out is that CTB ties two genuinely different jobs to the same property, using color to visually distinguish things on screen, and using color to control print thickness, and once a drawing has been alive for a while with dozens of layers each assigned a specific color purely for plot purposes, changing anything about the on screen color scheme, say, to make xrefs easier to distinguish visually, risks accidentally changing how thick something prints too, since you can't touch one job without touching the other in a pure CTB setup.
Named plot styles (STB): how the convention differs
Style based plot style tables, STB files, work differently, instead of mapping colors, they map a named plot style, something you explicitly assign to a layer or an object, directly to a set of output properties, decoupled entirely from what color the object is drawn in. This is the newer of the two conventions, and it's generally considered cleaner for larger, more complex projects, because you can use color freely for whatever purpose you actually want, visual distinction on screen, xref color coding, whatever, without that color choice being silently tied to how thick a line prints.
The tradeoff is that a drawing has to be set up as an STB based drawing from the start, a drawing template's plot style mode is chosen once when the DWT is created and isn't something you casually flip back and forth on an already active project, which is exactly why the choice between CTB and STB tends to get made at the office template level rather than decided fresh on every individual job.
Lineweight conventions: what governs line thickness on a plot
Regardless of which table type you use, the actual lineweight values you choose usually follow a rough hierarchy that most drafters converge on with experience, heavier lines, typically in the range of 0.5 to 0.7mm, for cut elements like wall sections and the outline of the object being drawn, medium lines, around 0.25 to 0.35mm, for visible edges and major annotation, and fine lines, 0.13 to 0.18mm, for hatching, construction lines and secondary dimension work. These aren't values imposed by AutoCAD itself, they come from broader technical drawing convention, the same logic that governs lineweight hierarchy on manually drafted engineering and architectural sheets long before CAD existed, and CAD just gives you a table to enforce them consistently instead of a drafter's steady hand.
The hierarchy matters more than any single exact number, a reader's eye should be able to tell at a glance which lines represent something physically cut through, which represent a visible edge beyond the cut plane, and which are just supporting annotation, and that visual separation is what actually makes a drawing fast to read, not the precise millimetre value chosen for each tier. Two offices with slightly different exact lineweight numbers can both produce perfectly legible drawings as long as each maintains a clear, consistent gap between its own tiers.
Choosing CTB vs STB for a new project
For a brand new project with no legacy baggage, STB is usually the more maintainable choice long term because it separates visual color from print thickness cleanly, but the honest, practical answer for most offices is still to match whatever the rest of the project, the client or the consultant team is already using, since mixing a CTB based set with an STB based set on the same job creates plotting inconsistencies that are genuinely painful to track down later. A huge number of existing office templates, especially anything with history going back more than a decade, are built on CTB, and there's rarely a strong enough reason to convert an entire active template library over to STB mid project.
A reasonable rule of thumb, absent any other constraint, is that CTB tends to make more sense for a smaller office running one or two consistent templates where the color to lineweight mapping is well understood by everyone using it, while STB earns its extra setup cost on a larger, multi discipline organisation juggling many templates, where decoupling color from print thickness prevents an accidental cross wiring between the two the larger and more collaborative a template library becomes.
It's also worth asking the question at the client level rather than purely the office level on any job where you're not the party controlling the master template, a consultant working inside someone else's project standards genuinely doesn't get much say in this choice, and trying to introduce a different convention mid project purely because you personally prefer it usually creates more friction than it resolves.
Setting lineweights up correctly and consistently
Getting lineweight right practically means opening your CTB or STB in the plot style table editor, going through each color or style entry, and assigning it a deliberate lineweight and, where relevant, a screening percentage for anything that should print lighter, like a shaded hatch or a background xref, rather than leaving every entry on the software's default. Save that table into your project template once it's right, reference it from every layout's page setup, and every new sheet built off that template inherits the same lineweight logic automatically instead of needing correction one layout at a time.
It genuinely helps to sketch the intended hierarchy out on paper first, cut lines heaviest, visible edges next, hatching and dimension extension lines lightest, before opening the table editor, because it's much easier to assign the right value to each entry when you already know the three or four tier structure you're aiming for, rather than adjusting individual color entries reactively based on how a specific object happens to look after each test plot. Once the hierarchy is settled and encoded in the table, it becomes a permanent office asset rather than something each project reinvents.
Common plotting mistakes that undo good drafting
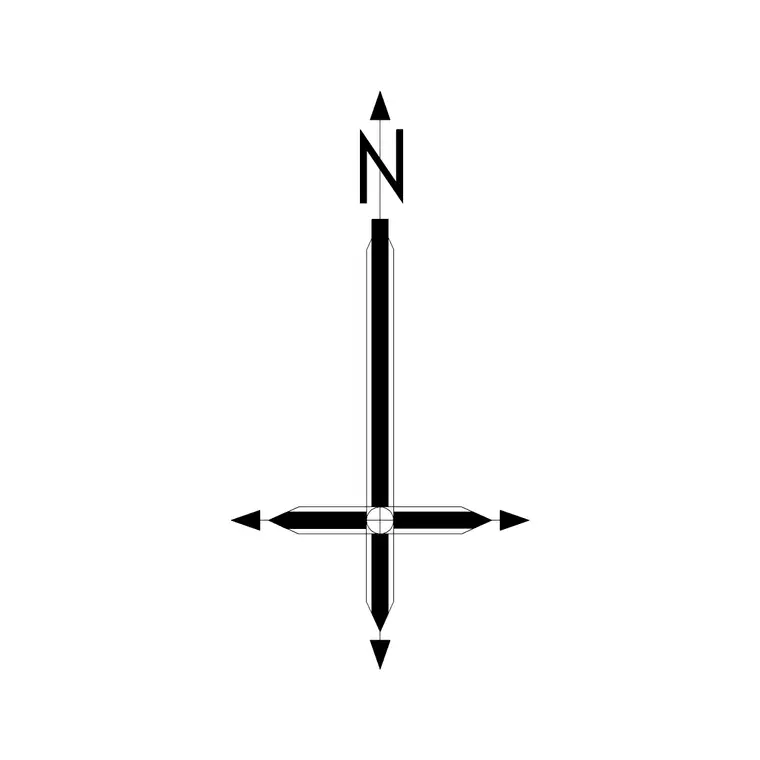
The mistake I see most often is a drawing that looks perfectly hierarchical on screen, thick walls, thin hatching, crisp text, and then plots almost flat because the layout's page setup was pointed at the wrong plot style table, or no table at all, and nobody checked the actual PDF or printed sheet before issuing it. The second most common one is an xref or an inserted block, a north arrow from an external library is a good small example, carrying its own color assignment that doesn't map cleanly onto your project's CTB, so it either prints far heavier or far lighter than intended, and the fix is always the same, check any inserted content against your plot style table before it goes out the door, not after.
A third, quieter mistake is applying the plot style table only at the layout level and forgetting that individual objects can carry their own explicit lineweight or plot style override, bypassing whatever the layer or CTB entry would normally assign, so a single stray object with a manually set property from months earlier can throw off an otherwise correctly configured sheet, and it's genuinely worth running a quick property check across a drawing periodically to catch overrides that have accumulated without anyone deliberately intending them.
Building the habit of checking before you issue
The single most reliable safeguard against all of this isn't a smarter table, it's a habit, export or print one genuine full size test sheet from every layout before a set goes out, not just a screen preview, and actually look at the lineweight hierarchy the way a reader will, not the way you already know the drawing is supposed to look. A screen preview inside AutoCAD, even with plot styles turned on for display, still isn't quite the same as the flattened raster or vector output a client actually receives, so treating an exported PDF as the real source of truth, rather than the DWG on your own screen, catches the majority of plot style mismatches before they become someone else's problem.
It's also worth keeping a single master CTB or STB file per office or per active client, version controlled the same way you'd version control a drawing template, rather than letting individual projects drift into slightly different copies over time, because a table that's been quietly tweaked on one job and forgotten is exactly how two supposedly identical projects end up plotting with subtly different lineweights years apart.
On a larger or longer running project specifically, it's worth periodically pulling a handful of sheets from different points in the set, an early one and a recently revised one, and comparing their printed lineweight hierarchy side by side, because plot style mismatches introduced mid project have a habit of only affecting the newer sheets, and a spot check across the whole timeline of the set catches drift that a single sheet check right before issue would miss entirely.
Further reading
Questions
Frequently asked
Can I convert a CTB file to an STB file?+
AutoCAD has a built in convert plot styles utility that can translate between the two, but the conversion isn't always a perfect one to one match, so it's worth manually spot checking a few sheets after converting rather than assuming it plotted identically.
What lineweight should a wall outline typically use?+
There's no single fixed rule, but most offices land somewhere in the 0.5 to 0.7mm range for cut wall lines against 0.13 to 0.18mm for fine hatching and construction lines, giving the eye a clear hierarchy between structure and detail.
Does the plot style table affect anything on screen, or only the printed output?+
By default it only affects what gets plotted or exported to PDF, model space and layout views on screen still show the object's native color and default lineweight unless you specifically turn on plot style display.
Why does an inserted CAD block sometimes plot at the wrong thickness?+
It usually means the block's internal layer or color assignment doesn't match an entry in your project's plot style table, so it falls back to whatever that color's default happens to be, which is why it's worth checking any inserted block, including something as simple as a north arrow symbol, against your CTB or STB before issuing a sheet.
Free downloads from this article


Free CAD block library
Download the blocks from this article — free, no signup